RSI indicator: how to work with the relative strength index?
 22 / 03 / 22
Visitors: 755
The Relative Strength Index (RSI) is a popular tool for day and intraday trading. If you don't know how to use it yet, you've come to the right place. In this article, we will talk about what makes this indicator unique, as well as how to calculate it and what traders use it for.
We will also discuss topics such as RSI trend lines, trading with RSI in some strategies such as RSI 2 period divergence and others. In addition, we will help you identify other indicators to use in conjunction with the RSI to improve your trading.
RSI indicator and technical analysis
Before we start discussing the best strategies and how to use the RSI indicator for intraday trading, we need to go over the basics.
Technical analysis is a method of predicting price movements and future market trends by analyzing historical data and comparing it with current data. Technical analysis is needed to understand what actually happened in the market and what can happen. It takes into account the price of instruments and creates charts from this data in order to use them as the main instrument.
One of the main advantages of technical analysis is that experienced analysts can follow many markets and trading instruments at the same time. There are three main principles in technical analysis that we need to consider before we delve into the RSI indicator:
The trend is your friend
Technical analysis is used to identify patterns (models) of market behavior. Many of these patterns are highly likely to produce the expected results. In addition, there are also patterns that appear on the charts with enviable regularity.
History repeats itself
The patterns that can be found on an asset price chart have been recognized and classified for over 100 years, and the way many of them repeat themselves suggests that human psychology has hardly changed over time.
Price Action devalues everything
This means that the price is a reflection of what the market knows about those aspects that can affect it, such as supply and demand, political factors and market sentiment. However, technical analysts are focused only on the study of price action, and not on finding out the reasons for possible changes.
One indicator that traders often rely on for technical analysis is the Relative Strength Index (RSI). Trading using the RSI indicator is becoming more and more popular due to its formula and the ability to use the RSI divergence.
Relative Strength Index: Basics
What is RSI in trading?
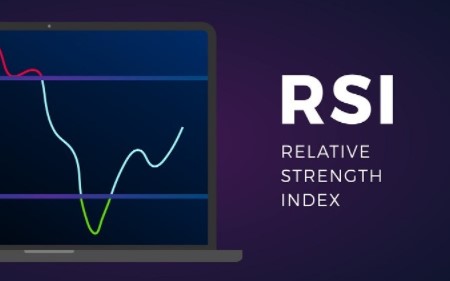
The RSI indicator (Relative Strength Index, relative strength index) is a tool that measures the ratio of upward and downward movements and standardizes the calculations so that the index is expressed in the range of 0-100. It was originally designed by J. Wells Wilder.
How to understand RSI?
If the RSI value is equal to 70 or more, it is considered that the instrument is in a state of overbought (a situation where prices have risen higher than the market expected). An RSI value of 30 or below is considered to be a signal that the instrument is in a state of oversold (a situation where prices fell lower than expected by the market).
How is the RSI indicator calculated?
The formula for the RSI indicator consists of two equations. The first equation is needed to obtain the initial value of relative strength (RS), which is the ratio of the average value of closing prices during an upward movement (“Up”) to the average value of closing prices during a downward movement (“Down”) for the period "N". Formula:
RS = Avg. closing price Up for period N / Avg. closing price Down during period N
The actual RSI value is calculated by indexing the indicator to a value between 0 and 100 using the following formula:
RSI = 100 - 100 / (1 + RS)
RSI indicator: best settings for intraday trading
Now let's discuss how to use the RSI indicator for intraday trading. For many traders, using the RSI indicator in an intraday trading strategy can be extremely useful.
The default RSI value of 14 periods is fine for most traders, especially swing traders.
But some intraday traders use different settings when using the RSI indicator for day trading. They don't like using the 14 period setting because they think the indicator generates trade signals too infrequently. As a result, some traders choose a shorter time frame, while others prefer to set a shorter RSI period to increase the sensitivity of the oscillator.
Generally:
- Short-term intraday traders often use RSI with shorter periods in the 9-11 range.
- Medium term swing traders often use the default period setting of 14.
Long-term traders usually set a longer period, in the 20-30 range.
Which settings to choose when using the RSI indicator for intraday trading depends on your strategy.
Relative Strength Index: How to Set RSI for a Day Trading Strategy
Choose the most suitable settings for your particular trading style by determining how much so-called market noise you are willing to process in the received data. Remember that no matter which setting you choose, as you work with this indicator, you will get better at recognizing reliable signals.
In the case of using the RSI indicator for intraday trading, you will be making short-term trades. In such cases, traders usually choose shorter periods, because in this way they receive signals earlier than others. As we mentioned above, short-term intraday traders usually use shorter periods in the 9 to 11 range.
Using the RSI Index in Trading Strategies
Now that you have a good understanding of the RSI indicator, you need to understand how you can effectively use the RSI indicator in trading. Here are some examples of RSI indicator settings for use in various trading strategies:
RSI OBOS Levels
This can be considered an RSI trendline strategy because its purpose is to predict when the price will bounce off the trendline so that the trader can enter a trade.
If the RSI is less than 30, it means that the market is oversold and the price may rise soon. After confirming the reversal, you can open a buy trade.
Conversely, if the RSI is above 70, it means that the market is overbought and the price may fall soon. Once the reversal is confirmed, you can place a sell trade.
The RSI 50 level is the middle line that separates the upper (bullish) and lower (bearish) territory. In an uptrend, the RSI is usually above 50 and in a downtrend it is below 50.
A complete list of unscrupulous brokers, that we do not recommend working with is available here.


